Choose to view the demo for:
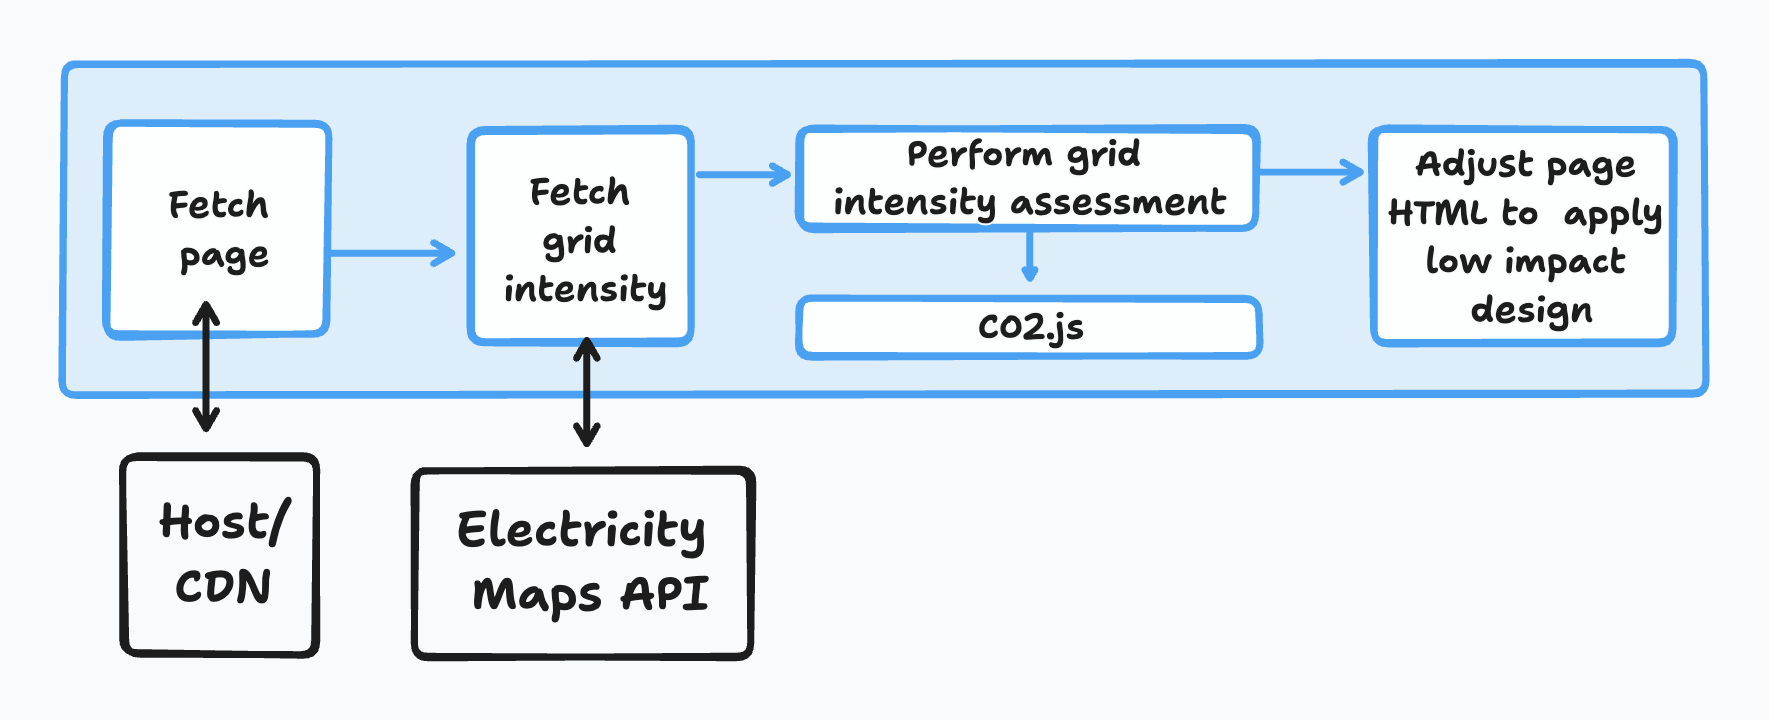
This page uses grid intensity data from Electricity Maps and CO2.js to determine if the energy grid in your location is "dirtier" than average. Based on that, some of the design and content loaded by this page will change.
You're seeing the page in light mode, which means either your local electricity grid is cleaner than average, or that no data was available for your region .
You're also seeing a custom font (Depature Mono) used on this page.
This page has been modified based on the below data:
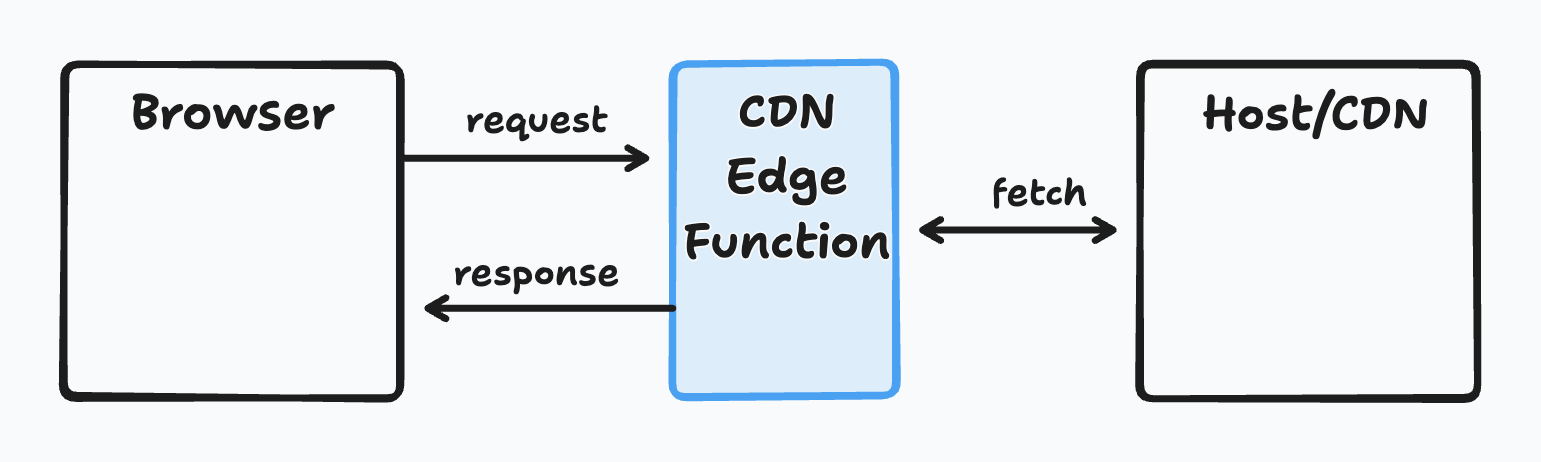
This page uses the grid-aware-websites code library to get the current energy grid intensity data from Electricity Maps. Based on the response, it will either return the regular site, or modify parts of the site to apply some low-impact web design practices (explained above).
All of this work takes part in a Cloudflare Worker, meaning there is JavaScript execution on the client device for any of this to happen.
This is a simplified snippet from the that works on this page.
Choose to view the demo for: